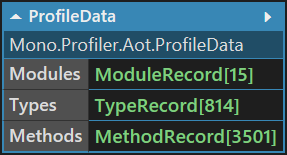
For as long as I can remember, Xamarin.Android has given developers the ability to choose between using JIT and AOT compilation for their applications. JIT'ed builds are far smaller, but carry the overhead of runtime method compilation. AOT builds are much larger, but generally more performant - often by a substantial margin. An old post by Adam Pedley is still a good reference if you want to know more about AOT on Android.
In general we are performance sensitve on Android, so the cost of JIT'ing many methods being called at startup for the first time is undesirable. Unfortunately, depending on marketplace, we are also often binary size sensitive too, making the size increase incurred by using AOT compliation also undesirable. Ugh - we can't win! If only there were a middle ground - some way to get the best of both worlds. If we could balance some of the startup improvements of an AOT'd build with the binary leanness of a JIT'd build, that might be an ideal compromise.
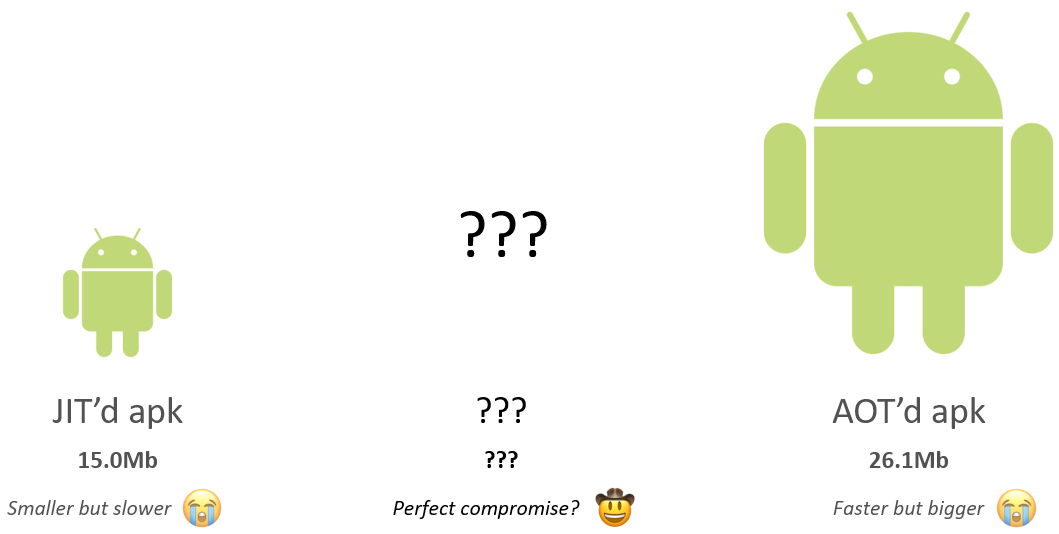
As you may know, a possibility of this nature has existed for a few months now in the form of a feature sometimes referred to as 'Startup Tracing' and othertimes referred to as 'Profiled AOT'. At the time of introduction, these names were technically correct, but practically less so. Where ideally the feature would be tailored to your specific app, in these early versions the 'startup' that had been traced was not. Instead, it was that of a secret, generic, Xamarin.Forms-based app stored somewhere deep in Xamarin laboratories, forced to repeatedly start up and shut down while engineers meticulously documented the methods being called in order to decide what parts of an app should be AOT'd to improve startup times.
Well that's what I heard anyway.
With the release of Visual Studio 2019 16.5 Preview 2, the Startup Tracing/Profiled AOT feature has been enhanced, and now allows developers to collect and use their own custom AOT profiles. This means that an AOT profile can be tailored specifically to an individual app - covering all the libraries and frameworks being used during startup or otherwise.
AOT Profiles? Huh?
So what's an AOT profile? Why is it called Profiled AOT? How is it different to full AOT?
Essentially, if you build a Xamarin.Android app using profiled AOT it comes out as a kind of hybrid JIT/AOT entity, containing both a mixture of ordinary .NET IL that will be JIT'd at runtime, plus some fully AOT'd code generated during the build process. Whether or not a given method in the app is AOT'd is determined by an AOT profile, which at its core is a list of methods that should be AOT'd. In theory, if a method isn't listed in the profile, it won't be AOT'd and will be JIT'd at runtime instead (although sometimes I saw results that suggest inputs other than the profile might influence whether something gets AOT'd). With that in mind, using profiled AOT makes it possible to selectively AOT-compile performance-sensitive parts of an app, allowing targeted size/performance tradeoffs and a 'best of both worlds experience'. Yes!
What about 'Startup Tracing'?
Well (in my opinion) 'Profiled AOT' is the correct name for the feature just described - using an AOT profile to selectively AOT-compile parts of the app. Startup Tracing could reasonably refer to the process of recording method calls made during startup in order to produce an AOT profile tailored towards improved startup performance. Whilst this is the most likely use for profiled AOT on Android, it's worth mentioning that an AOT profile need not include only methods called during startup, and could conceivably include any combination of methods you think should be AOT'd because they are performance sensitive.
Getting started with Profiled AOT
Making use of profiled AOT involves two distinct steps:
- Creating (or capturing) an AOT profile
- Use the AOT profile when building the app
The steps are outlined briefly in the documentation here, so this will be a more hand-holding version of that. Note that you'll need at least Visual Studio 2019 16.5 Preview 2 or VSMac 2019 8.5 Preview 2 to use this feature, and that the instructions here are for Windows but should be adaptable for macOS without too much trouble.
Step 1: Capturing an AOT profile
Given a general understanding of how your app starts up and the libraries it uses, it would be possible to try to create an AOT profile that covers startup by hand. However, doing so would be laborious, error prone and likely to contain both omissions or unneccessary inclusions. With VS 16.5 Preview 2, Xamarin.Android includes a new msbuild target that can build an app in profiling mode, allowing the app to automatically keep track of method invocations being made while the app is running. To take advantage of this target, you should have an Android device plugged in to your machine, and a VS2019 Preview Developer Command Prompt open to the directory in which your Android project lives. For later steps, it's useful to open the prompt as Administrator.
The name of the target for profiling is BuildAndStartAotProfiling and you can invoke it using the following syntax:
msbuild /t:BuildAndStartAotProfiling
You'll see a lot of ordinary build output and then a few new bits. The app will also be launched on the device.

When built and launched via the BuildAndStartAotProfiling target, the app is automatically keeping track of method invocations, and (by default) is listening on port 9999 for something to connect and retrieve the logs. Although we are talking about startup, it's worth keeping in mind that when running under this mode the app records all invocations that occur, not just those on the startup path. This means that if you continue to interact with the app after it starts up, the methods that are invoked as a result of those interactions will also be captured in the logs, and will form part of the final AOT profile.
Once you're happy that the app has completed startup, you need a way to retrieve the profile data from the device. To do so, you need to keep the app running and use a second target, FinishAotProfiling, to connect and retrieve the logs.
msbuild /t:FinishAotProfiling MyApp.csproj
That target appears to wrap a default invocation of aprofutil (on windows, lives in C:\Program Files (x86)\Microsoft Visual Studio\2019\Preview\MSBuild\Xamarin\Android\), and you'll get better diagnostics by invoking it directly:
aprofutil -s -v -f -p 9999 -o "custom.aprof"

One point to note with the aprofutil is that it appears to require Adminstrator privileges to execute correctly (that's why I said to open the prompt as Admin earlier). However, it also requires adb to be on the PATH, which generally isn't the case for the VS Developer Command prompts. Because I'm lazy, my workaround was to open an Android ADB prompt from Visual Studio Tools -> Android -> Android ADB Prompt, then add the PATH from that prompt to the end of the PATH in the running Admin prompt. Don't @ me.
From the log you can see that a new file was written - custom.aprof. Congratulations - you've now generated a custom AOT profile!
Step 2: Using the AOT profile when building the app
The UI support in Visual Studio for working with custom AOT profiles is not complete, so it's easiest to just edit your .csproj by hand. First, you need to add a reference to the custom profile with the appropriate item type:
<ItemGroup>
 <AndroidAotProfile Include="$(MSBuildThisFileDirectory)custom.aprof" />
</ItemGroup>
Then, in the Release section of your csproj, add properties that instruct profiled AOT to be used, and for the default profile to not be used.
<AndroidEnableProfiledAot>true</AndroidEnableProfiledAot>
<AndroidUseDefaultAotProfile>false</AndroidUseDefaultAotProfile>
If you're in a project that has previously used AOT or startup tracing, you may also need to remove other configuration elements related to those.
And that's it! Now, when you perform a Release build of your app, the custom AOT profile will be used to determine which methods to AOT. You'll see slightly different output in the build log demonstrating this:

When comparing the size of AOT content to an apk that has been fully AOT'd, one that uses the startup profile should be substantially smaller. It turns out the perfect apk does exist, and in the case of the PrismZero app, the size impact is quite low:
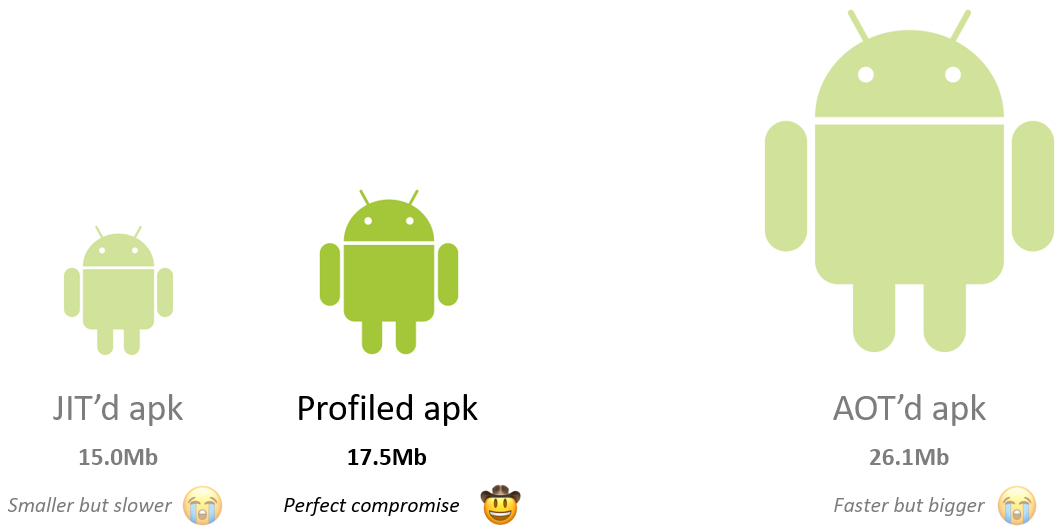
Of course, given PrismZero is a demo app, your mileage may vary and you should run the numbers on your own apps.
What is a profile anyway?
If you're curious, you can use the aprofutil to perform basic inspection of a custom profile:
aprofutil -as custom.aprof
This will print all (-a) kinds of entries in the profile - modules, types and methods to the console, then print the summary (-s) we saw earlier. There are a few other arguments that can be used to filter the output, but it's relatively unweildy.
It's also possible to programatically inspect the profile by referencing Mono.Profiler.Log (on Windows, it lives at C:\Program Files (x86)\Microsoft Visual Studio\2019\Preview\MSBuild\Xamarin\Android\Mono.Profiler.Log.dll) and loading the profile using the ReadAllData method on the ProfileReader class. In this format, we can see it's a set of Module (essentially, 'assemblies'), Type and Method records:
The modules, types and methods are listed in the order they are accessed, which can interesting information in itself. Because there are so many entries, I filtered most out to give an idea of what each looks like:
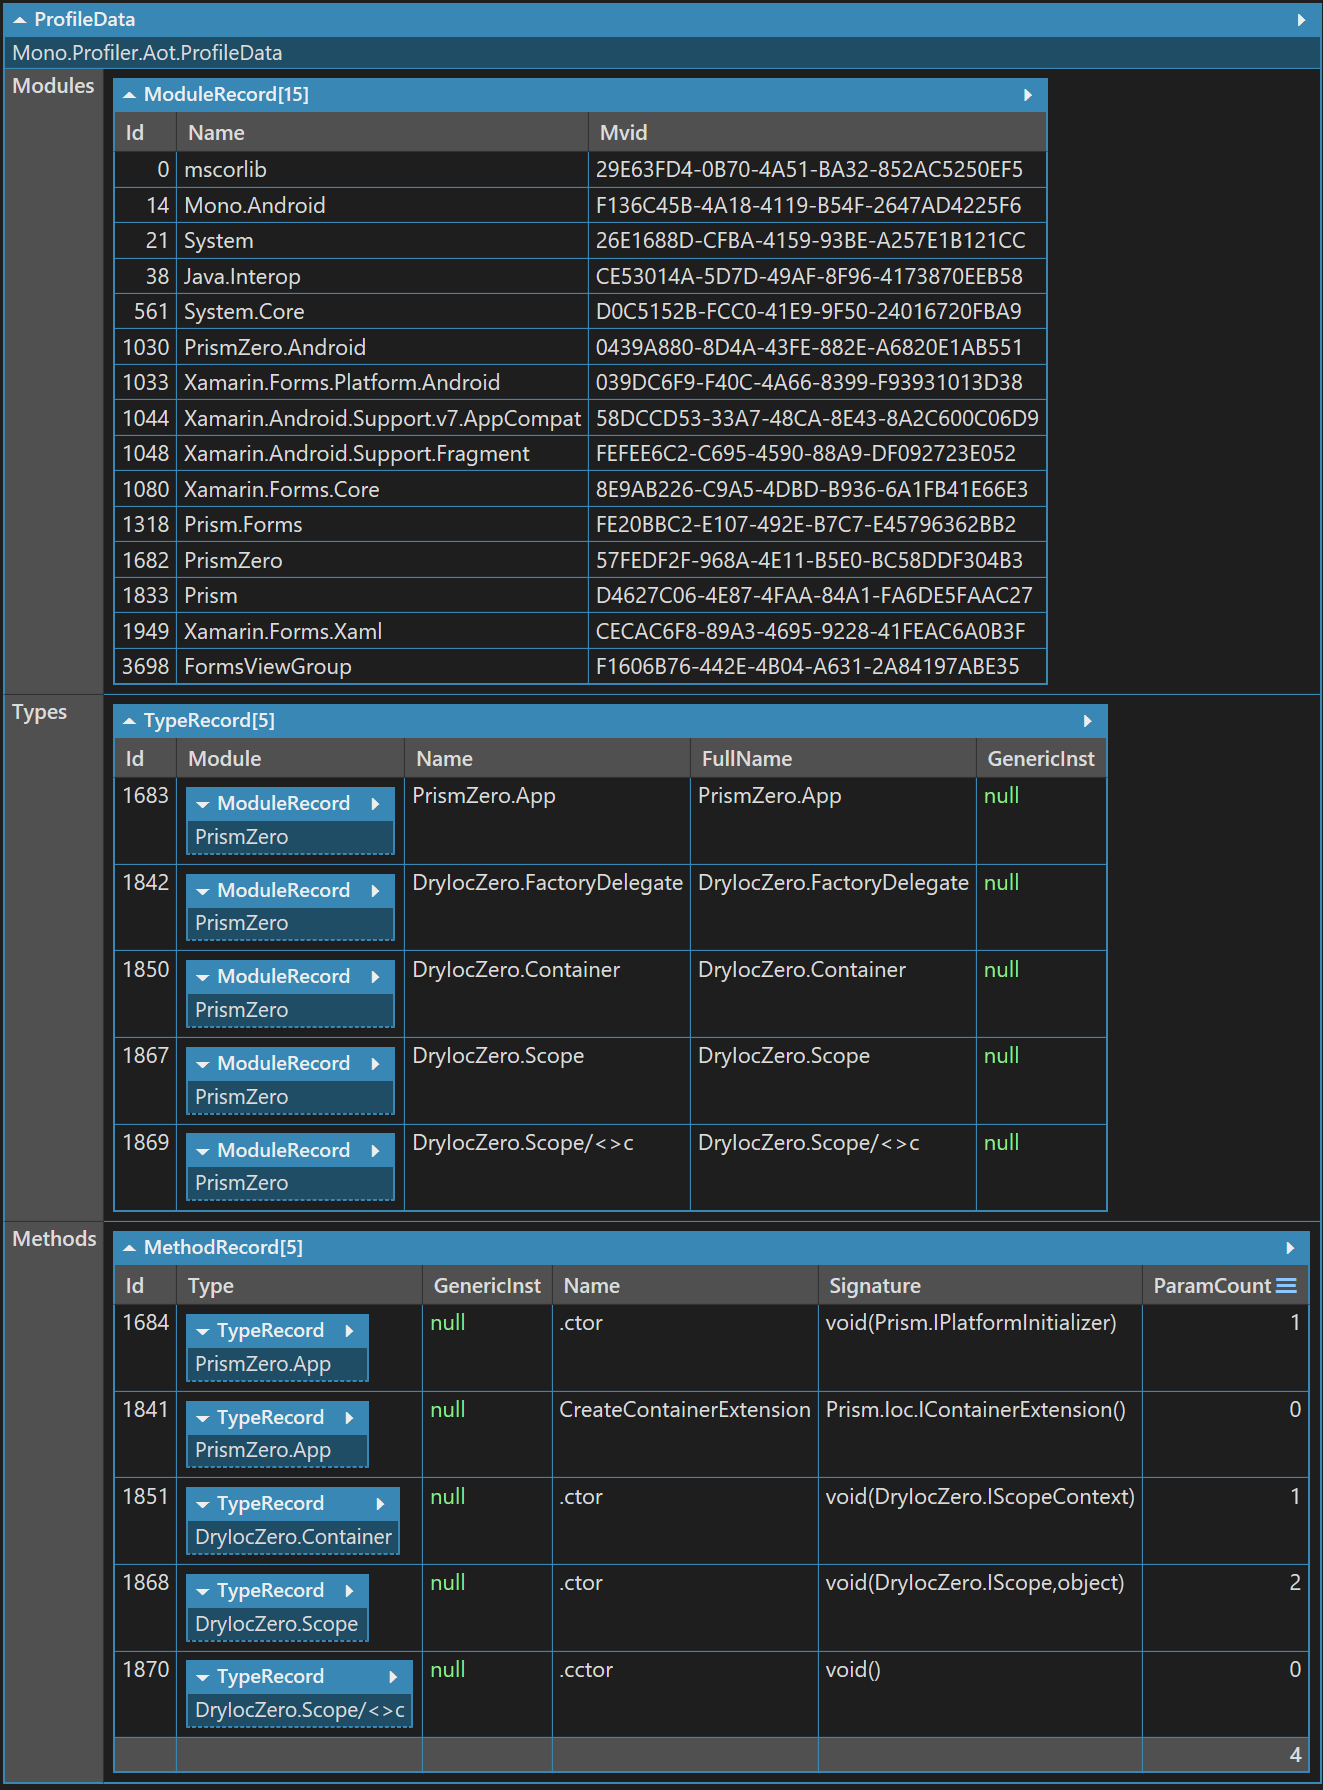
As we can see from this filtered set of types, during the early stages of startup there are a lot of constructors (ctor) being invoked, as well as the important Prism app CreateContainerExtension method. From the chart in my earlier post on DryIocZero (shown below), we saw that the container setup time (whether using zero or otherwise) improves substantially on Android under AOT, so it is beneficial for us to include it in the AOT profile.
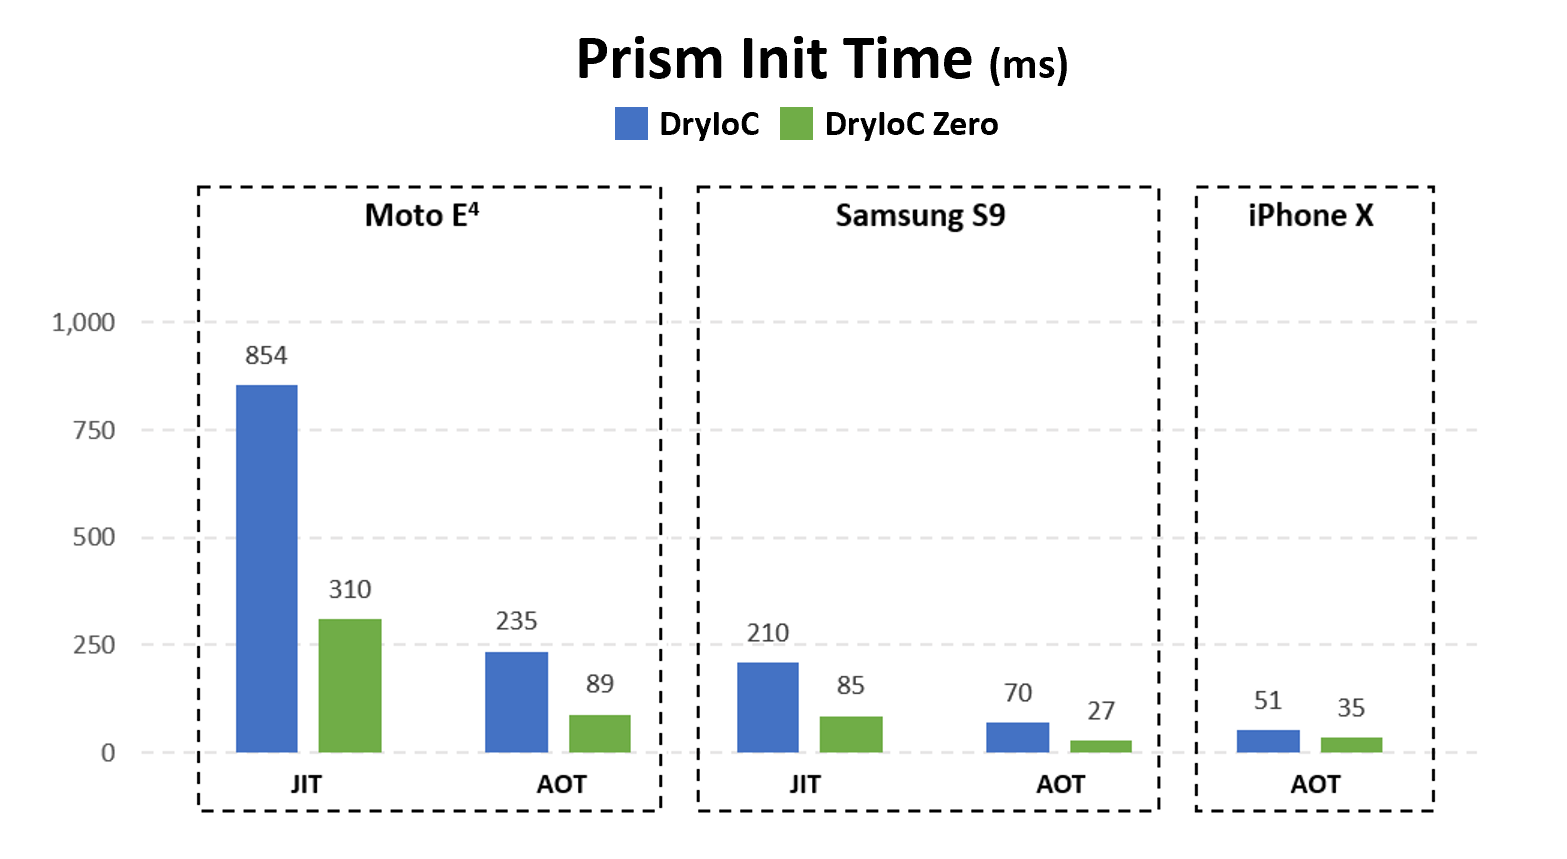
Of course, being specific to our app, methods related to container initialisation would not be AOT'd using the default Startup Tracing profile in earlier versions of Visual Studio. It's the ability to produce a profile specific to your app's startup and libraries that makes this new iteration of the feature so compelling.
If you noticed earlier, we used a ProfileReader to load the AOT profile data. There's also a ProfileWriter class that can be used to write a new or changed profile back. The ProfileData class is immutable, meaning you should create a new instance with a different set of data, but we can also remember that in .NET there is no spoon, and just alter an existing instance directly using reflection.
Modifying a profile can open up more advanced scenarios. For example, we could merge the contents of two profiles (e.g. a 'logged out' startup path and a 'logged in' startup path), or we could combine information from a startup trace with other convention-based AOT decisions (e.g. AOT all startup methods + all ContentPage InitializeComponent methods), if we thought that were appropriate from a size/performance tradeoff perspective. Whilst regenerating a startup trace during CI is more challenging because it requires the app to be launched, regenerating convention-based profile contents for a Forms-based app at build time is quite reasonable. Maybe an experiment for a rainy day.
Should I use this?
Unless you are extremely binary-size sensitive, profiled AOT really does look like a compelling feature to start using. It's relatively easy to set up, and should net some good performance improvements if you aren't using full AOT now, or a nice size decrease without a major performance impact if you were already using full AOT. Keep in mind that as an app evolves, the methods called during startup may change too, so regenerating a profile from time to time is a good idea.
Happy profiling!
